Bing Maps Samples
Welcome to the Bing Maps Web Control V8 Sample Gallery.
This is a collection of 227 code samples that have been made open-source on GitHub.
Enterprise account customers can continue to use Bing Maps for Enterprise services until June 30th, 2028. Free (Basic) account customers can continue to use Bing Maps for Enterprise services until June 30th, 2025. To avoid service disruptions, all implementations using Bing Maps for Enterprise REST APIs and SDKs will need to be updated to use Azure Maps by the retirement date that applies to your Bing Maps for Enterprise account type. For migration documentation, please see Bing Maps Migration Overview. For more details on the retirement, see the announcement on the Bing Maps Blog.
To get started with Azure Maps, simply create a free Azure subscription and add an Azure Maps account by following the steps here. See also our Azure Maps Samples and Bing Maps Migration documents.
Animated Tile Layer (3)
Provides a layer which can smoothly animate through an array of tile layer sources.
Controlling an Animated Tile Layer
This example shows how to control an AnimatedTileLayer by using the play, pause and stop functions.

Animated Tile Layer Events
This example uses the onFrameLoaded event of the AnimatedTileLayer class to update a message about the currently display tile layer in the animation.
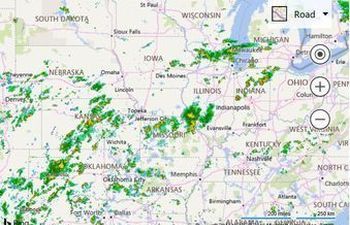
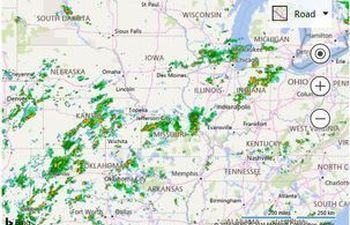
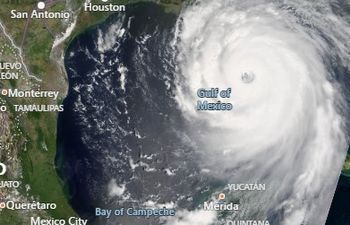
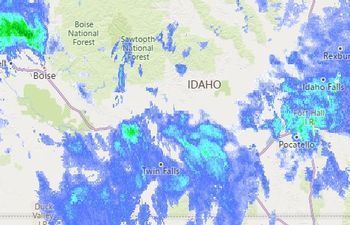
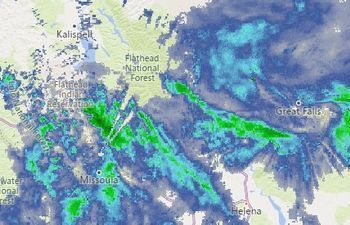
Animated Weather Radar Map
For this example the weather radar tile service are from the Iowa Environmental Mesonet of Iowa State University and animates.
Autosuggest (5)
The Autosuggest module takes in a string of text and provides a list of suggested addresses or places that are similar to the provided string of text. This module can be used with a map, or independently on its own.
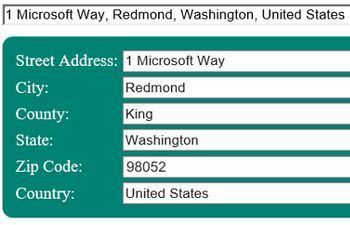
Filling in an Address Form
This example shows how to use the selected result from the default autosuggest UI to fill in an address form.
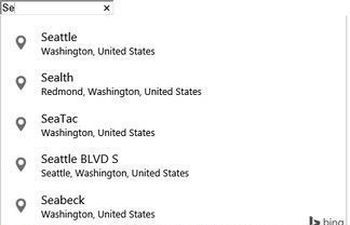
Default Autosuggest User Interface
This sample shows how to add the default autosuggest functionality to a textbox.
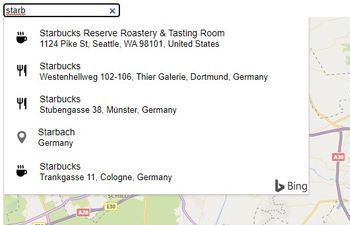
Business Suggestions
This sample shows how to include business listings in the autosuggestion module.
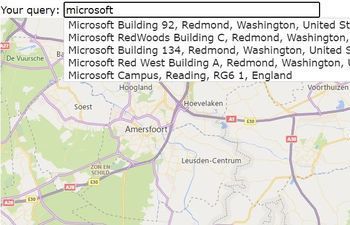
Custom Autosuggest
This sample shows how to create a custom input UI for Autosuggest.
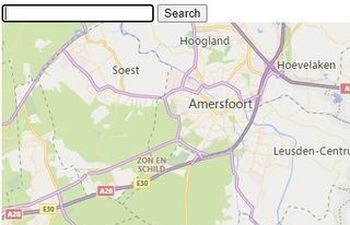
Autosuggest with Search button
This sample shows how to add a search button to an autosuggest box.
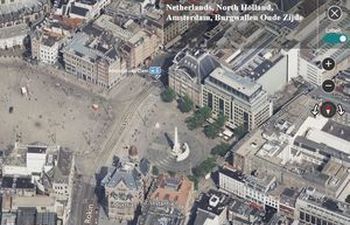
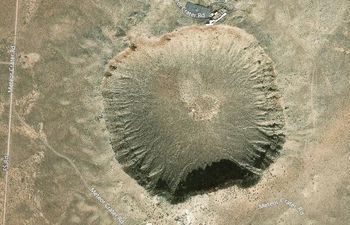
Birdseye (2)
High resolution aerial imagery taken at 45 degrees to the ground, from 4 different directions.
Map View Automatic Transition
This sample shows how to automatically transition the map from aerial to birdseye and vice-versa when zooming.
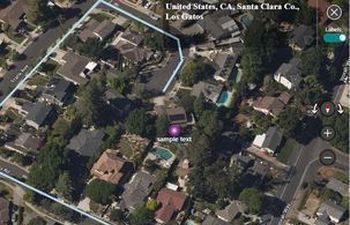
Birdseye Basics
This sample shows how to load the map into Birdseye mode and display data on top of it.
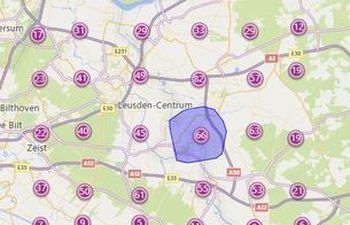
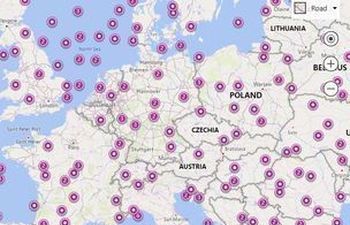
Clustering (6)
Clustering is a method where pushpins that are close together are grouped and represented as a single pushpin, often using a different icon to indicate the cluster.
Cluster Areas
This sample shows how to show the area in which the pushpins in a cluster cover when hovering over a cluster.
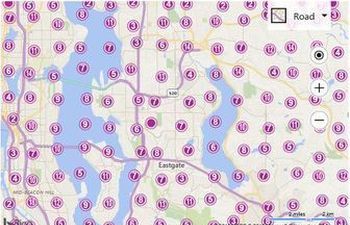
Basic Clustering
This sample shows how to implement basic pushpin clustering into your app.
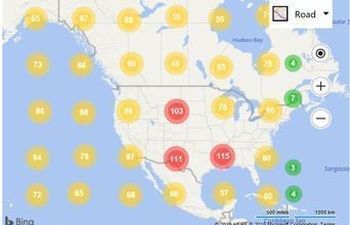
Customizing Clustered Pushpins
Customizing the clustered pushpins can be done by passing a callback function into the clusteredPinCallback option of the cluster layer.
Clusters with a List and Linking
This example shows how to dynamically create a list of the pushpins that are currently displayed in the clustering layer and also link each list item back to the clustered pushpin.
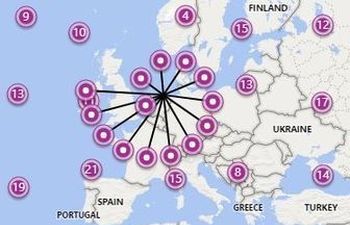
Spider Clusters
This sample shows how to create make clustered pushpins display the pushpins they contain in a connected spiral when they are clicked.
Zoom into Clusters
When clicked, a bounding box is calculated based on the location of the pushpins in the cluster. This bounding box is then used to zoom into the cluster.
Configuration (2)
Configuration driven maps allow you to quickly and easily create a map with your data with little to no coding required.
Load a Configurable Map with Code
In addition to being able to load a map configuration file via an iframe, they can also be loaded in your application code as well
IFrameable Configuration Map
A map configuration file can be loaded as a URL parameter of the Bing Maps configurable map page which can then be viewed in a browser as-is or embedded into a web app using an iframe.
Contour Layer (3)
Contour Lines, also known as isolines, are lines that connect points that share a characteristic of equal value.
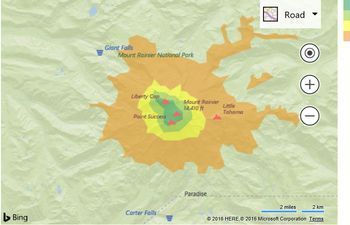
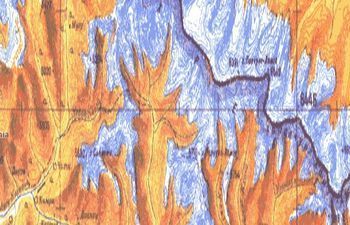
Basic Contour Layer
This example takes contour line data that represents elevations around Mount Rainer.
Circles
Calculate the locations for a regular polygon that has 36 locations which will rssult in an approximate circle.
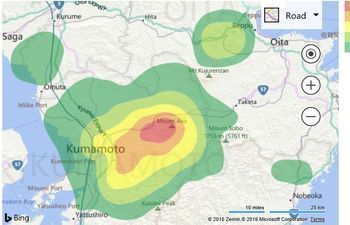
Contours from GeoJSON data
This example downloads earthquake intensity contour data from the USGS for earthquake M7.0 - 1km WSW of Kumamoto-shi, Japan.
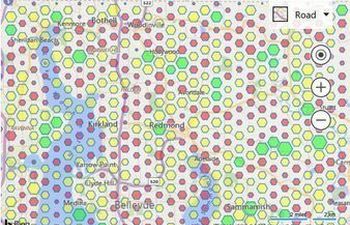
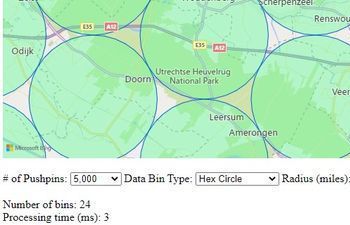
Data Binning Layer (5)
Data binning, is the process of grouping point data into a symmetric gird of geometric shapes.
Bivariant Data Binning
Since the size and the color can both be customized based on an aggregate value it is possible to have a single data bin represent two data metrics (bivariant).
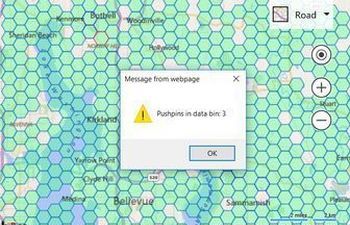
Data Binning Layer Events
Events can be added directly to the layer and will fire for the shapes in the layer. Alternatively, you can also loop through each shape in the layer and add an event to individual shapes.
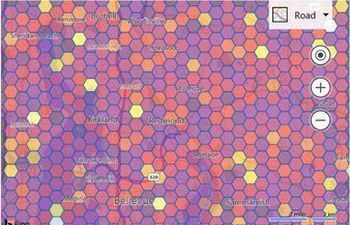
Color Scale Gradient Data Bins
This example shows how to use a linear gradient to assign colors to data bins based on the relative number of pushpins in each bin.
Data Binning Options
A set options the define how a data binning layer is rendered.
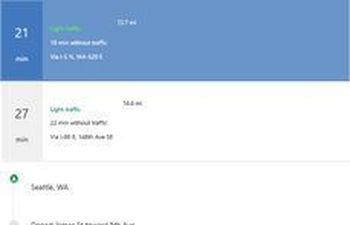
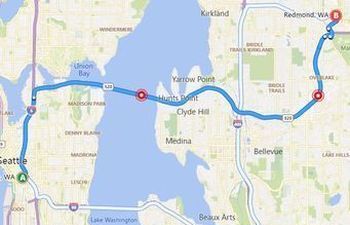
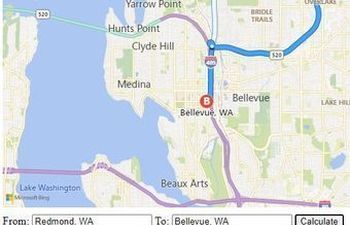
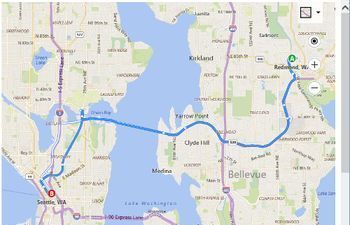
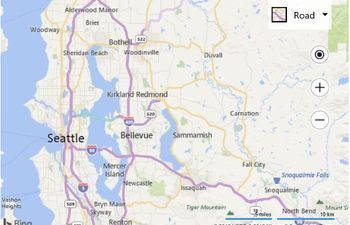
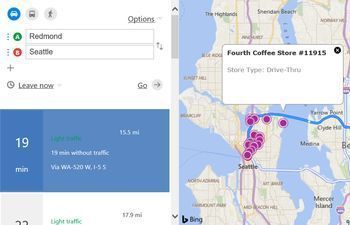
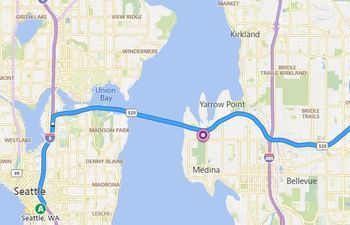
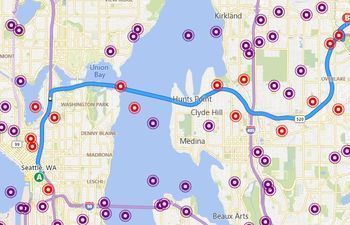
Calculate Driving Directions
The following example shows how to calculate driving directions from Seattle to a Work location.
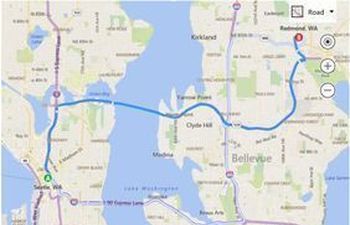
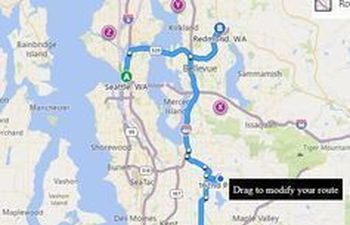
Continuous Tracking and Routing
This sample shows how to use the browsers geolocation API to continuous track a users position and their route to a destination on the map.
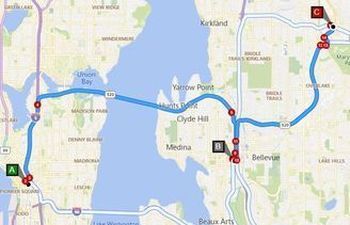
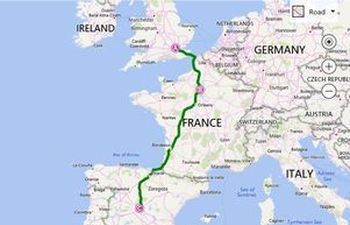
Display Multiple Routes
Calculate and display multiple routes using the getRoute function.
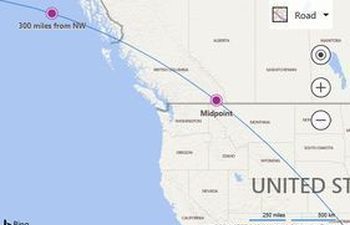
Evenly Spaced Locations
The purpose of this code sample is to calculate Locations along a route which are spaced out evenly using a specified distance.
Directions Module Events
This example shows how to use events with the directions manager.
Fully Custom Waypoint Pushpins
This sample shows how to hide the default route waypoint pushpins and create completely custom pushpins for the waypoints, and instruction steps.
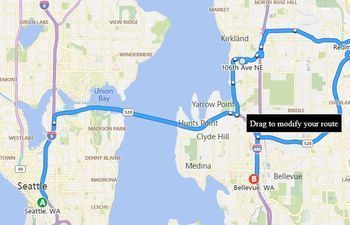
Get Dragged Route Waypoints
This sample shows how to use the directions managers getAllWaypoints function to retrieve all the waypoints used to generate a route.
Directions Input Panel
Directions with Options
When calculating directions request options can be used to modify how the route is calculated. Render options can be used to customize how the route is displayed on the map.
Simple Custom Directions Input Panel
This sample shows how to create a simple custom input panel for direction calculations.
Snap Directions Waypoint to Pushpin
This sample shows how to snap a directions route to pushpins on the map.
Calculate Transit Directions
The following example shows how to calculate transit directions leaving an hour from the current time.
Drawing Tools (19)
The drawing tools module provides tools that allow the user to draw and edit shapes on the map.
This sample shows how to add events to a shape that has just been drawn on the map.
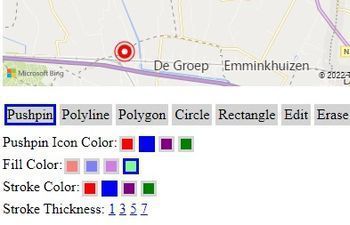
Display Drawing Toolbar on Map
This example shows how to add a drawing toolbar to the map so that the user can draw shapes.

Clear all shapes
Resets the drawing manager and clears all shapes in the drawing layer
This sample shows how to customize which options in the drawing toolbar are displayed.
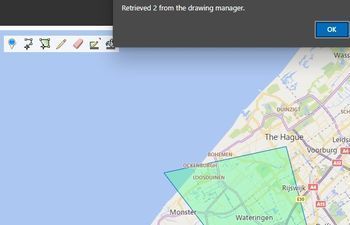
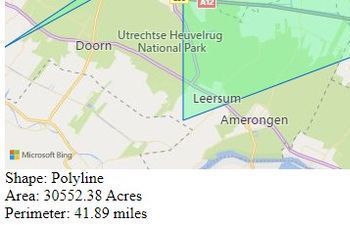
Get Shapes from DrawingManager
This example shows how to get all the shapes that are in the drawing manager at any time.
Edit an Existing Shape
This example shows how to take an existing polygon and enable editing on it.
Drawing Manager Events
The example adds a bunch of events to the drawing manager that is created by the drawing tools module.
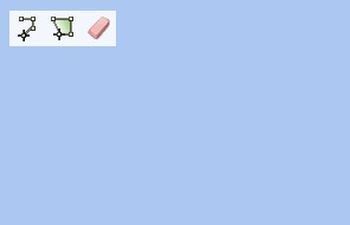
Fully Custom Drawing Toolbar
Create your own fully custom drawing toolbar and controls.
Overlapping Polygons
This sample shows how to attach and detach events so it is possible to draw overlapping or polygons completely overlapping other polgyon.
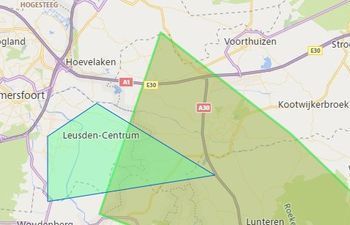
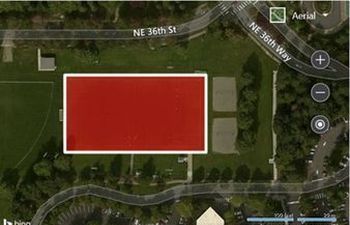
Restrict drawing to Polygon area
This sample shows how to restirct the drawing of shapes to such that they must fit inside a specified polygon area.
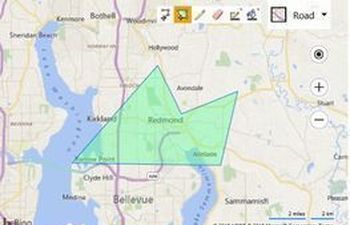
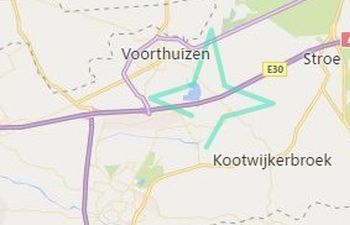
Select Data in Drawn Polygon Area
This sample shows how to use the drawing tools to draw a polygon search area on the map and then search for all shapes on the map that are within that polygon.
Snap Drawing to Shape
This sample shows how to use the drawing tools and spatial math modules together.
Events (7)
The Bing Maps control provides many events to allow your application to respond to user actions.
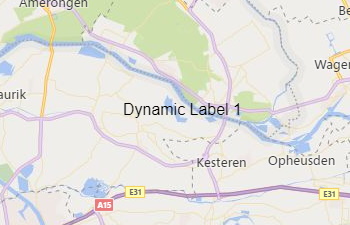
Map Events
This example shows how all the different events for the map work by highlight a label to indicate which event fired as you use the map.
Freehand Drawing
This sample shows how to freehand draw a polygon on the map using a mouse or touch.
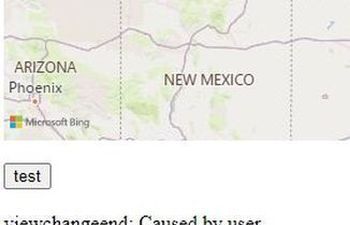
Map Events
Shows Map Events, like viewchangestart, viewchange, viewchangeend, click, dblclick, mouseover, mapresize, etc.
Map View Events
The following code sample demonstrates how to add an maps events handler.
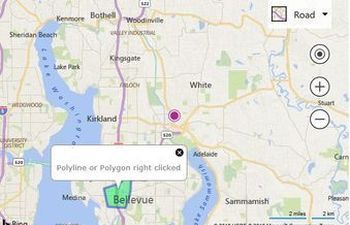
Right Click Events for Shapes
This example shows how to use the right click event on a layer to trigger right click events on shapes.
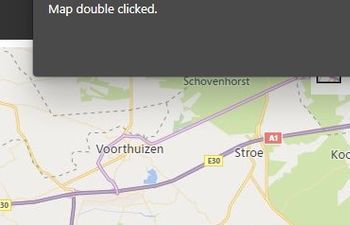
Single vs Double Click
This sample shows how to distiguish if the single click event is truely a single click or not.
GeoJSON (9)
GeoJSON is a common file format used for storing spatial data as a JSON object. The GeoJSON module makes it easy to import data that is in this format into Bing Maps.

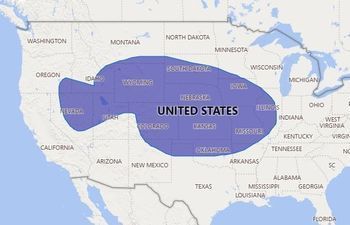
Choropleth Map
Running this code will display a map of the USA with color coded US states based on population.
GeoJson CORs
This sample shows how to load GeoJSON data that is hosted on another domain and has Cross-origin resource sharing (CORS) enabled.
GeoJson Drag and Drop
This code examples shows how to enable drag and drop a local GeoJSON file onto a map.
GeoJson Shape Events
This sample shows how to add events to shapes loaded from the GeoJSON module and have an infobox displayed when they are clicked.
GeoJson Cross Doamin without JSON
This sample shows how to load GeoJSON data that is hosted on another domain, but does not support JSONP.
Read GeoJSON using JSONP
This sample shows how to load GeoJSON data that is hosted on another domain using JSONP.
Read Local GeoJSON Object
This sample shows how to read GeoJSON data that is in a local variable and apply a set of style options when it is being read.
Read Same Domain GeoJSON
This sample shows how load a GeoJSON file that is hosted on the same domain.
Write Shape as GeoJSON
This sample shows how generate GeoJSON from an array of Bing Maps shapes.
GeoXml (7)
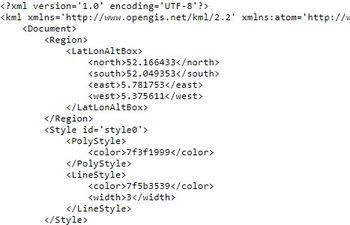
The GeoXml module makes it easy to read and write common geospatial XML file formats such as KML (Keyhole Markup Language), KMZ (compressed KML), GeoRSS, GML (Geography Markup Language, exposed via GeoRSS), and GPX (GPS Exchange Format).
Basic GeoXmlLayer
This sample shows how to load a string of geospatial XML data, in this case GeoRSS, into a GmlXmlLayer.
Gpx with Metadata
This plugin allows you to import GPX files with Metadata into Bing Maps.
Read Geospatial XML String
This sample shows how to read a string of geospatial XML data.
Read Geospatial XML from URL
This sample shows how to read a geospatial XML file that is hosted on the same domain
Read Geospatial XML Files from Same Domain
This sample shows how to load geospatial XML data from locally hosted files.
GeoXml Write
This sample shows how to export shapes from the map as geospatial XML.
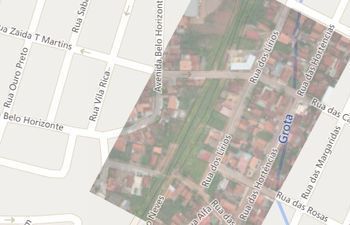
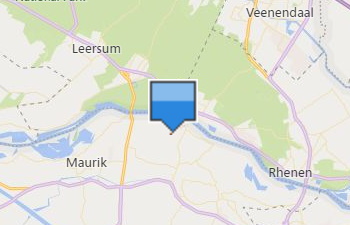
Basic Ground Overlay
This sample shows how to load a basic ground overlay on the map.
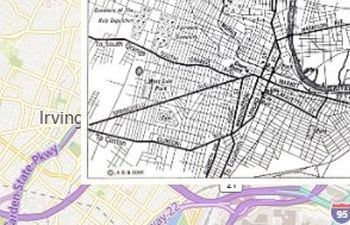
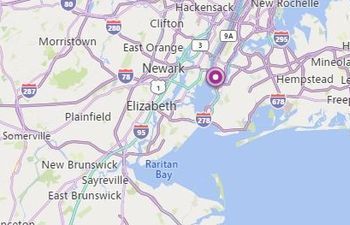
Newark New Jersey 1922 Ground Overlay
This sample shows an image of a map of Newark New Jersey from 1922 as a Ground Overlay.
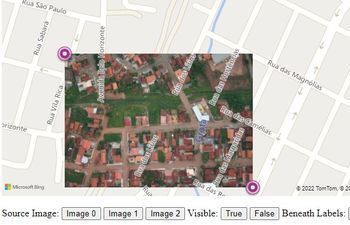
Ground Overlay Options
This sample shows how to set an get all options for ground overlays.
SVG Ground Overlay
This sample shows how using an SVG as a ground overlay ensures that no matter how much you zoom into the ground overlay, it stays crisp and clear.
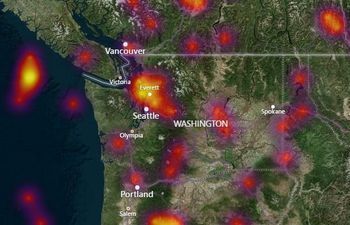
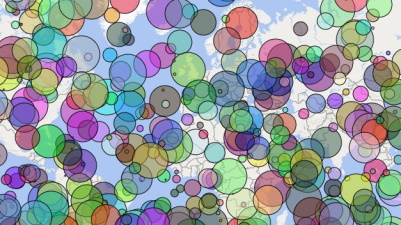
Heatmap Layer (5)
Heat maps, also known as density maps, are a type of overlay on a map used to represent the density of data using different colors. Heat maps are often used to show the data “hot spots” on a map.
Basic Heat Map
The following example loads 1,000 random locations into a heat map that are within the initial view of a loaded map.
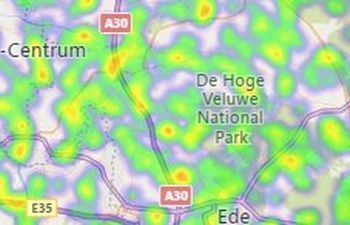
Customized Heat Map
The heat map is customized such that the intensity is increased to 0.65, and a custom color gradient is used.
Heatmap Features
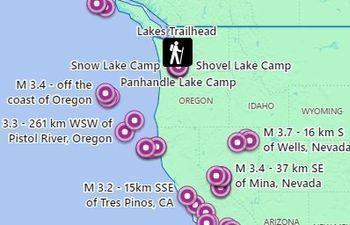
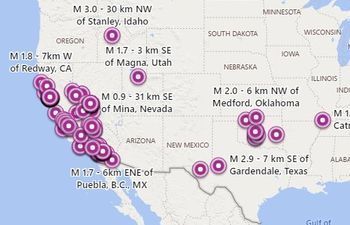
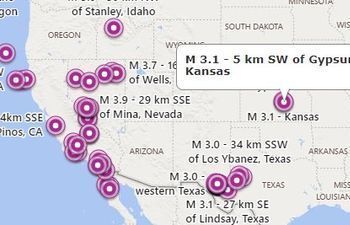
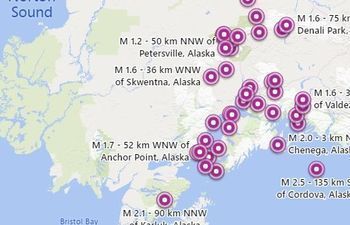
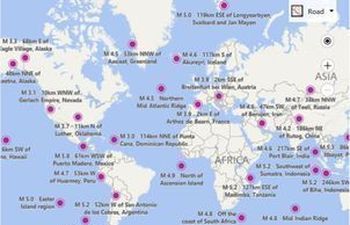
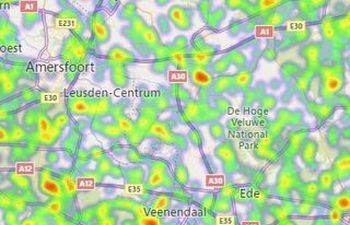
Render GeoJSON as Heat Map
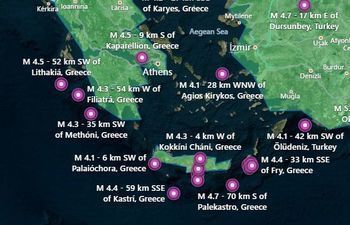
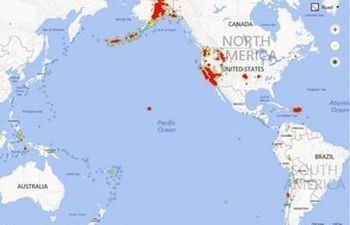
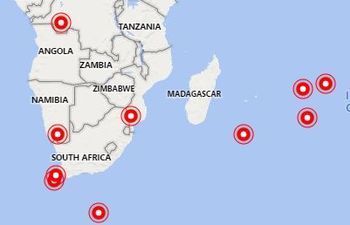
This code sample loads in earthquake data for the last 30 days and displays them as a heatmap layer.
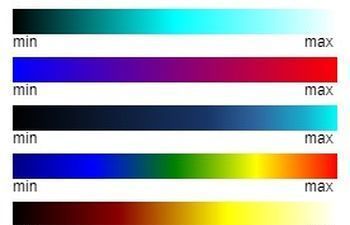
Heat Map Color Gradients
The color gradient heat map option is used to colorize the intensity of the heatmap.
Infobox (8)
An infobox, also sometimes refer to as an info window or popup, is a simple panel that displays information over top the map.
Basic Infobox
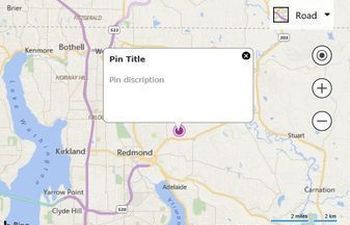
The following code shows how to add an infobox with a title and description to the center of the map.
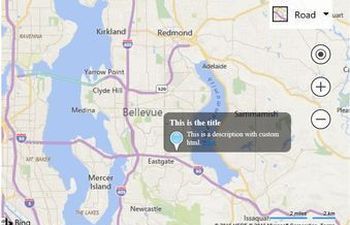
Custom HTML Infobox
This example shows how to create an infobox using custom HTML.
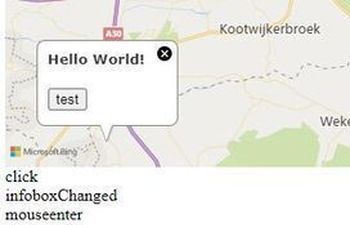
Infobox Events
Shows Infobox Events, like click, infoboxChanged, mouseenter and mouseleave.
Expanding Tooltip Infobox
Show the title when the user hovers over a pushpin like a tooltip, and if they click on the pushpin, then open the full infobox that contains the title and description.
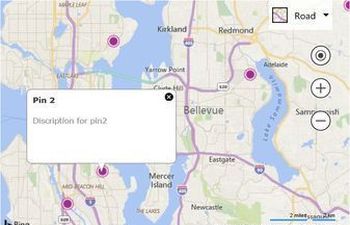
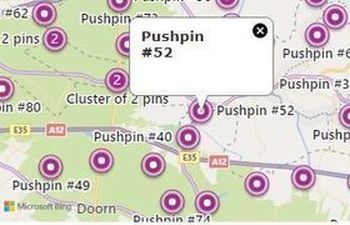
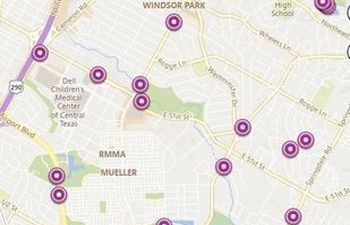
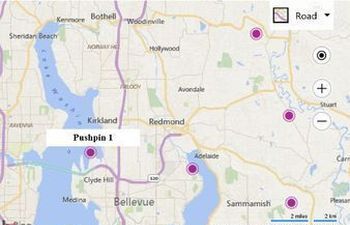
Multiple Pushpins and Infoboxes
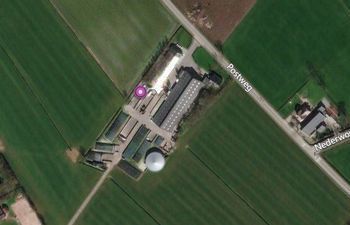
This example creates 5 pushpins at random locations on the map. If you click on any of them, an infobox will be displayed with the content for that pushpin.
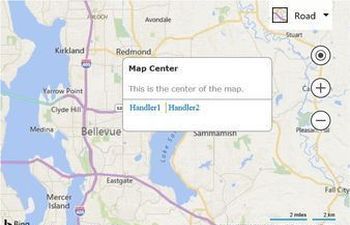
Infobox with Options
This example shows how to create and infobox with the options that hide the pointer and close button, and additional has two action links.
Infobox when Pushpin Clicked
When the pushpin is clicked an infobox is opened and the title and description values are retrieved from the metadata stored in the pushpin.
Infobox when Shape Clicked
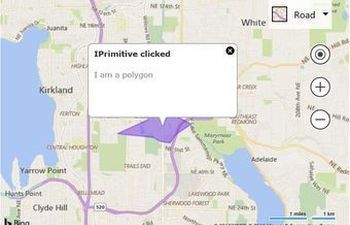
This example shows how to handle the click events from any IPrimitive shapes and display an infobox on top of them.
Basic Layer
The Layer class makes it easy to organize groups of data by storing them in separate layers on the map.
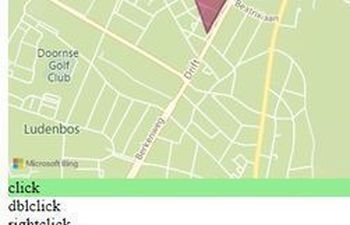
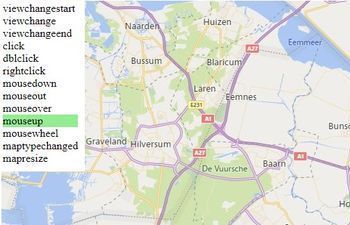
Layer Events
Shows layer events, like click, dblclick, rightclick, mousedown, mouseout, mouseover and mouseup.
Limit Layer to Zoom Range
This sample shows how to limit the visibility of layers to specified zoom level ranges.
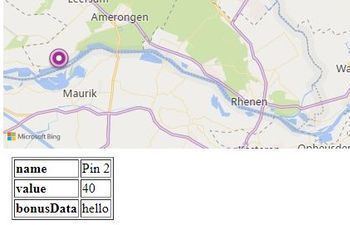
View Shape Metadata
This sample adds a click event to a layer. When any shape in the layer is clicked, it's metadata is then displayed as a table.
Layer Z Index
The Polygon and TileLayer renders below the traffic flow tile layer using the Z Index.
Z Index Swap
When you click on a shape in a layer, it swaps the zIndex of the layers such that the layer the shape is in, is on top.
Map (19)
The map is the primary control in the Bing Maps Map Control that provides an interactive surface for visualizing your data.
Context Menu
This sample shows how to display a context menu when the user right clicks the map.
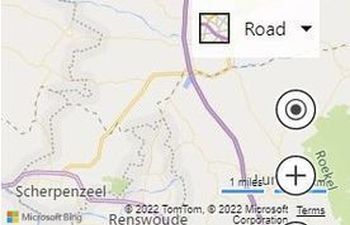
Custom Navigation Bar
This sample shows how to create a custom navigation bar by hiding the default navigation bar and floating custom navigation controls over the map.

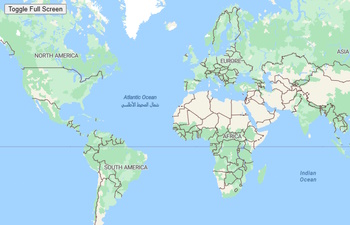
Full Screen Map
This sample shows how to toggle between displying the standard page layout, and a full screen map view.
/screenshot.jpg)
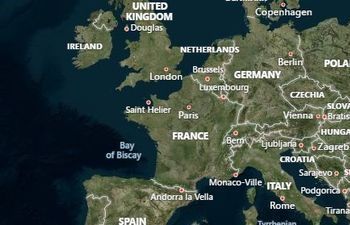
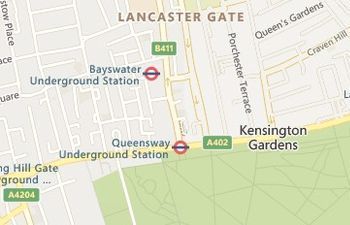
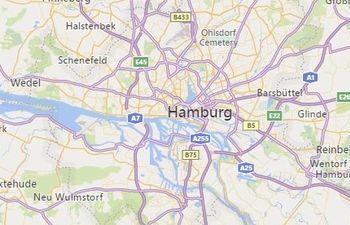
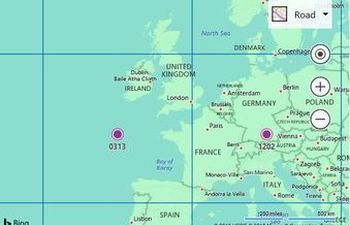
Localize the Map (en-GB)
This sample shows how to localize the map to the en-GB market and language (British English).
/screenshot.jpg)
Localize the Map (fr-FR)
This sample shows how to localize the map to the fr-FR market and language (French).
/screenshot.jpg)
Localize the Map (zh-CN)
This sample shows how to localize the map to the zh-CN market and language (Chinese).
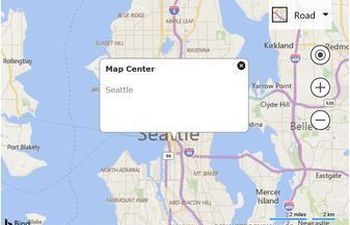
Map Center Offset
This sample shows how to offset the center of the map by 100 pixels horizontally, and 50 pixels vertically.
Map in liteMode
When liteMode is set to true vector labels are disabled and are rendered directly on the map tiles.
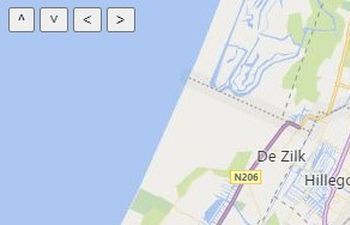
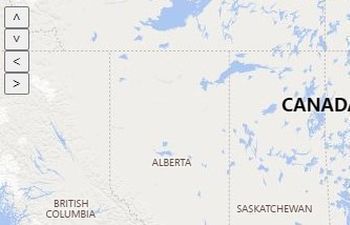
Map Pan Buttons
This sample shows how to add a simple panel of buttons for panning the map.
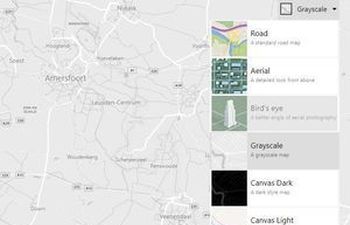
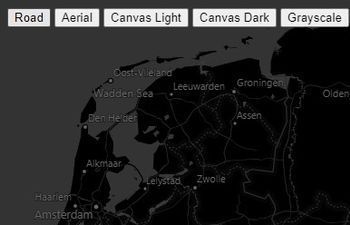
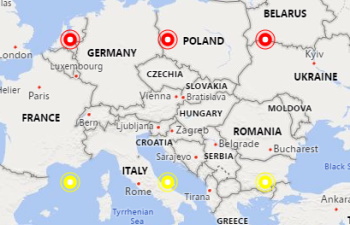
New Map Styles
This sample shows how to use display the new map styles in the dropdown of Bing Maps; Canvas Dark, Canvas Light, and Grayscale.
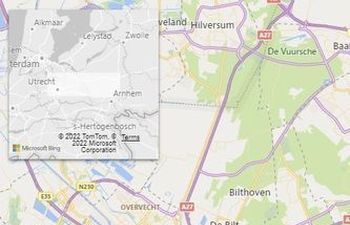
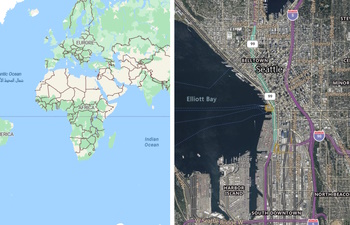
Overview Map with Custom
This sample shows an overview map with custom style on top of a map.

Streetside look at location
Use the streetside options to location to look at.
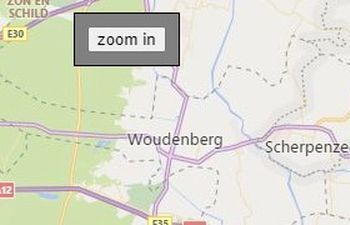
Mouse Wheel Zoom Overide
This sample shows how to override the mouse wheel behaviour so that it zooms into the center of the map rather than into the pointer location.
Load Map with Custom Style
This sample shows how to load the map with a custom map style.
Set Custom Map Style
This sample shows how to set the custom map style after the map is loaded.
Bing Maps with AngularJS App
Bing Maps with AngularJS web application framework sample.
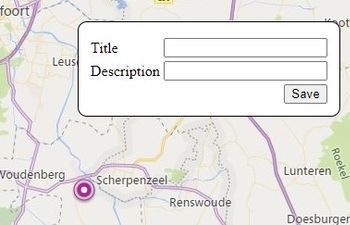
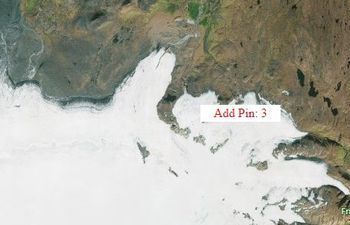
Create Pushpin and Add Metadata
This sample shows how a form can be displayed to enter metadata for a pushpin after it has been added to the map.
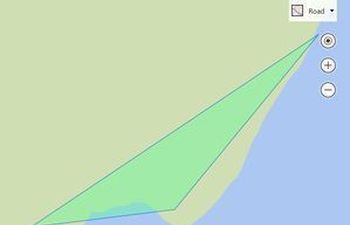
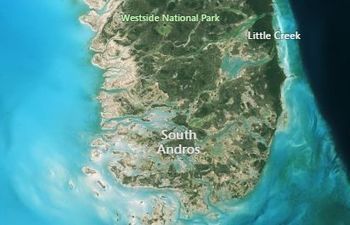
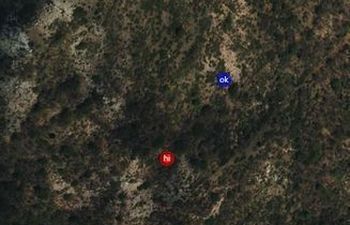
Distance to nearest coast
This sample shows how to the approximate distance to the nearest coastline can be calculated from a point on the map.
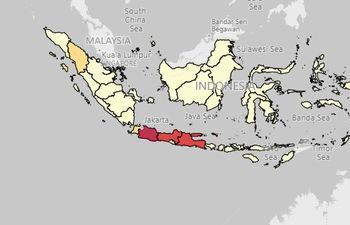
Indonesian Province Census Map
This sample shows how to create a simple choropleth map which retrieves boundary data from the GeoData API in the Bing Spatial Data Services.
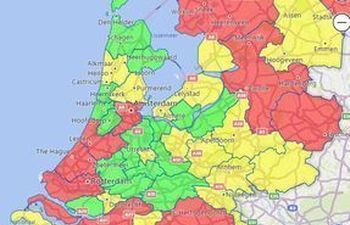
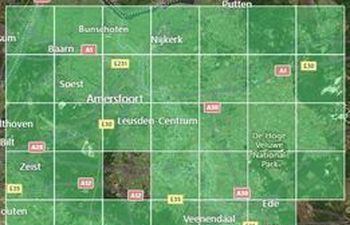
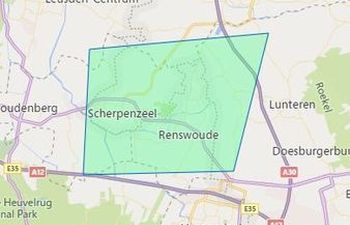
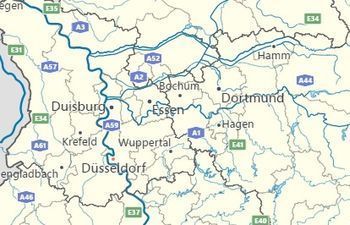
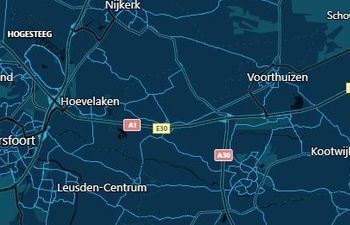
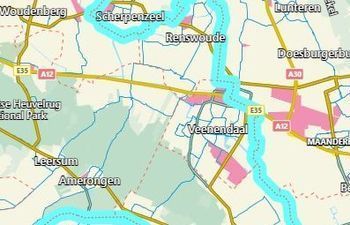
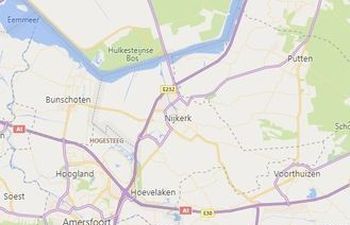
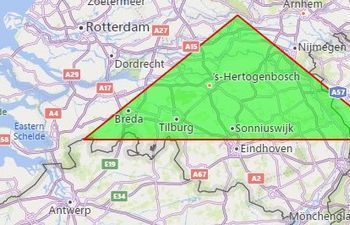
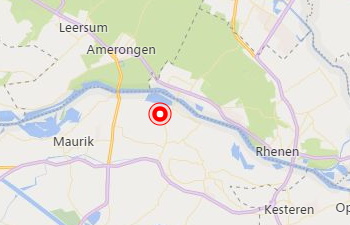
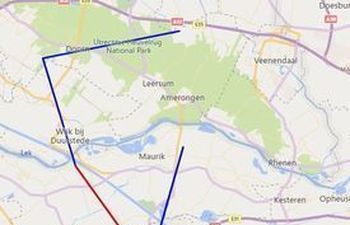
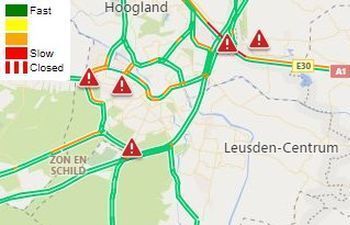
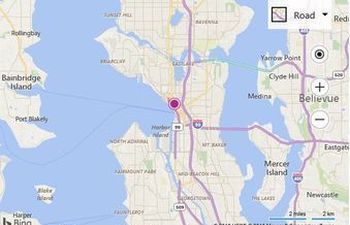
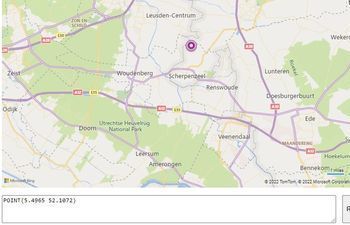
Netherlands Census Map
Map of the Netherlands showing the population deatils per province.
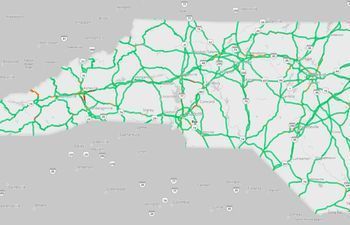
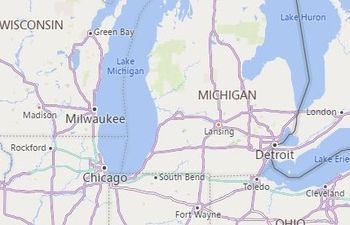
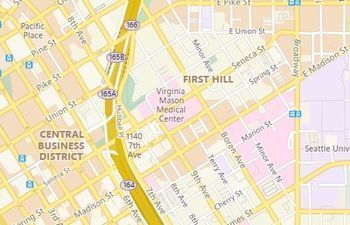
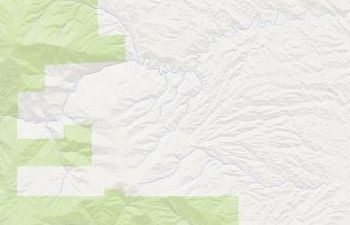
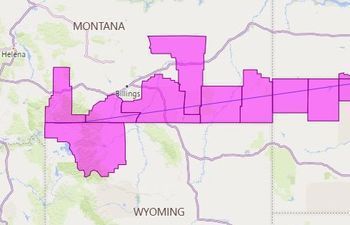
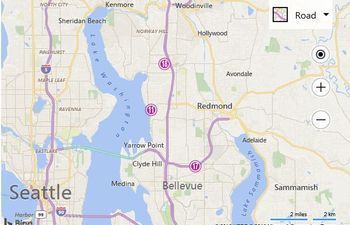
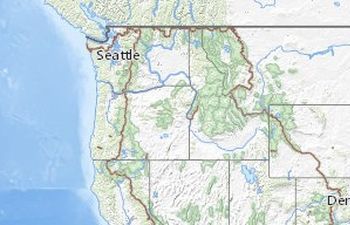
North Carolina Map
This code sample shows how to create a map that is focused on a single area. In this case North Carolina.
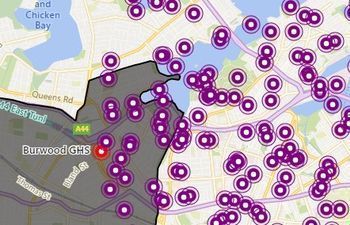
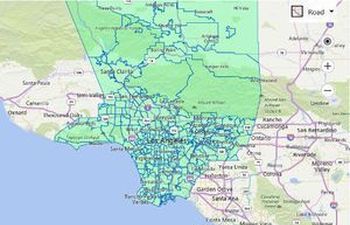
NSW School Zone Search Map
This sample shows how to combine a custom data set (New South Whales School catchment boundaries) with the isochrone service to find locations that are in the intersecting area.
RequireJS and Bing Maps
This sample shows how to load a Bing map using RequireJS.
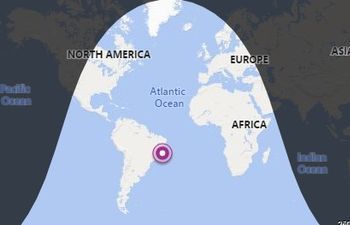
Solar Terminator
This sample is of a module that calculates the Solar terminator (shadow of where the sun don't shine) as well as the suns approximate overhead location on the map.
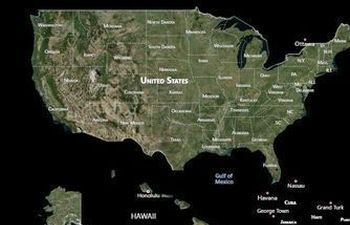
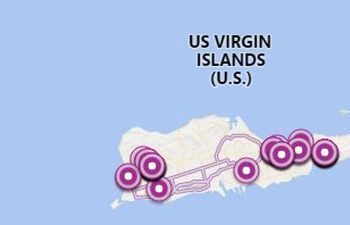
US Virgin Islands SNAP Retailers
Overlays (4)
Custom Overlays allow you to create and insert your own custom layers into the map. These layers can consist of static overlays such as custom navigation bars, or dynamic overlays such as custom data visualization layers.
Basic Overlay
This sample shows how to create a basic custom overlay which contains buttons that the user can interact with.
Canvas Overlay
This sample shows how to use a canvas to create a custom rendering layer.
HTML Pushpin Layer
This sample shows how to create a custom layer for display HTML based pushpins using a Custom Overlay.
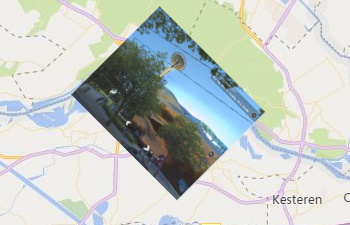
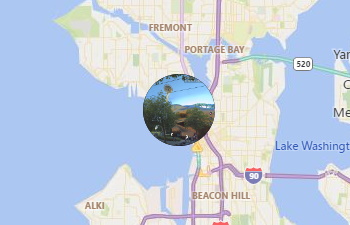
Topographic Overlay
This sample shows how to create a Topographic Overlay, also commonly known to as an image overlay, using the Custom Overlay class.
Points (1)
Points are used to represent a pixel coordinate or offset. This is often used by pushpin anchors, and map location to pixel conversion calculations.
Point Compression
The PointCompression class provides a compression algorithm to encodes/decodes a collection of Location objects into a string and back.
Polygons (4)
A polygon is an area defined by a closed ring of locations. A simple polygon consists of an array of Location objects that form a boundary.
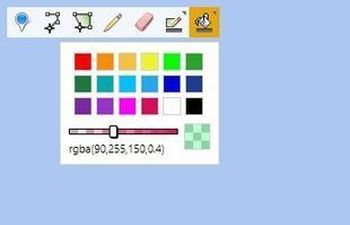
Polygon Basics
The following code creates a simple polygon that has a red outline and a semi-transparent green fill color, and has a stroke thickness of 2 pixels.
Polygon Events
This example attaches several mouse events to a polygon. When these events fire they highlight a label to indicate which event fired.
Polygons with Holes
he following code is an example that creates a complex polygon that has a hole cut out of it.
Polygon with Label
This sample shows how to add a label to a polygon by using a pushpin.
Polylines (4)
Polylines allow you to draw connected lines on a map. In many spatial database systems, this is also known as a LineString.
Polyline Basics
The following code creates a polyline that is red in color, has a thickness of 3 pixels, and has a dash array where the stroke/gap sequence is [4, 4].
Polyline Events
This example attaches several mouse events to a polyline. When these events fire they highlight a label to indicate which event fired.
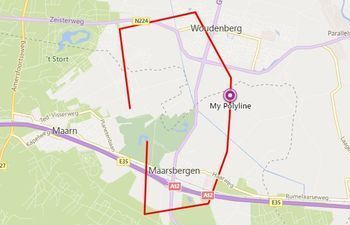
Polyline with Label
This sample shows how to add a label to a polyline by using a pushpin.
Prevent Polylines from Crossing the Anti-Merdian
This sample shows how to modify polylines sby adding an additional midpoint location to each segment of the polyline which is visually accurate to keep the lines looking striaght.
Pushpins (23)
Pushpins, sometimes known as MapIcons or Markers, are the primary method in the Bing Maps Map Control to add a graphical image and text at a location within the map.
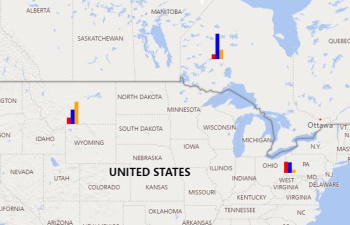
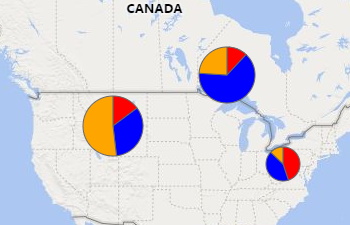
Pushpin Bar Chart inline SVG
This sample shows how to create pushpins that look like bar charts using inline SVG's.
Custom Base64 Image Pushpin
This example takes the following base64 string of an image and uses it to create a custom pushpin in the center of the map.
Custom Canvas Pushpin
You can see how to dynamically create a custom image using an HTML5 canvas and use it to create a custom pushpin.
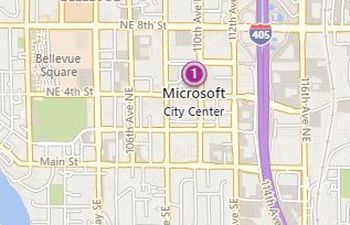
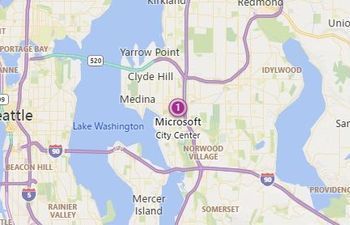
Default Pushpin with Text
The following code creates a pushpin at the center of the map that has a text value set to '1'. A title value set to 'Microsoft' and a subTitle value set to 'City Center'.
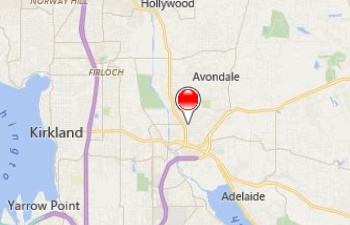
Image and Canvas Pushpin
This code example shows how to create custom colored pushpins that use an image as a template.
Pushpin Changed Event
This samples shows when a property of pushpin has changed.
Custom Map Labels
This sample shows how to create custom labels on the map by using pushpins.
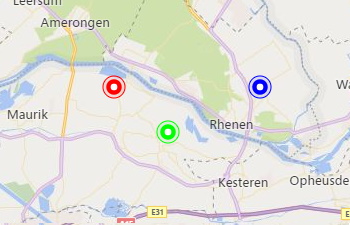
Draggable Pushpin
This sample shows three pushpins. The green pushpin is draggable and has events attached to it.
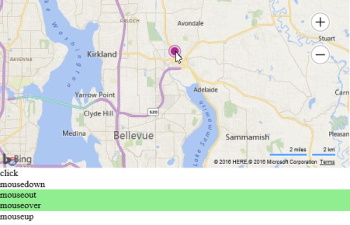
Pushpin Events
This example attaches several mouse events to a pushpin. When these events are triggered they highlight a label to indicate which event fired.
Font based Pushpins
This example shows how to use a custom font to create pushpins icons. For this example, the Font Awesome library is used.
Pushpin Hover Style
This example uses mouse events to update the pushpin options when a user mouses over, press down and mouses out of the pushpin.
Image Sprite Pushpins using a Canvas
This sample shows how to use and image sprite to create pushpins via an HTML canvas.
Custom Image Pushpin
You can use the following code to create a pushpin using the image. An anchor is used to specify what part of the image should be anchored to the location of the pushpin.
Custom Inline SVG Pushpin
You can use the following code to create a pushpin using the SVG image of the sun. An anchor is used to specify what part of the image should be anchored to the location of the pushpin.
Inline SVG Pushpin Template
This sample shows how to use an inline SVG as a template for a pushpin.
Scaled Pushpin
This sample shows how to use a canvas to create a scaled pushpin.
Scaled Circle Pushpins
This sample shows how to create custom pushpins that are scaled circles (bubbles).
Scaled Pie Chart Pushpins
This sample shows how to create pushpins that look like scaled pie charts using inline SVG's.
Changing the color of the default Pushpin
Runing this code in a browser will display a red pushpin in the center of the map.
Custom SVG File Pushpin
You can create map images using Scalable Vector Graphics (SVG). These images will look better across different sizes and device display resolutions.
Search (3)
The Bing Maps SDK provides the ability to do forward and reverse geocoding through the Search module.
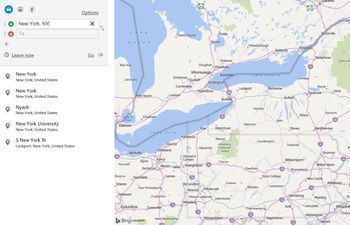
Geocode
The following code sample shows how to make a geocode request using the Search module. This code loads the search module if it isn't already loaded, geocodes 'New York, NY', adds a pushpin to that location, and sets the map view over the result.
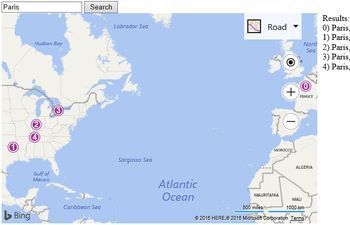
User Input Geocode
When the user types in a query and presses the search button a check is done to see if the Search module is loaded. If it is loaded, the users query is then geocoded.
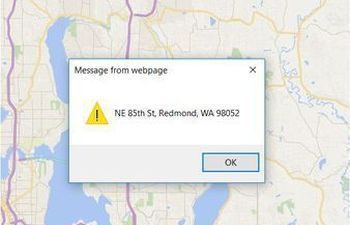
Reverse Geocode
The following code sample shows how to make a reverse geocode request using the Search module.
Spatial Data Services (18)
The Bing Spatial Data Services allow you to upload data and have it exposed as a spatial REST service for use in your application.
Basic Intersection Search Query
This sample does a basic intersection query against a data source in the Bing Spatial Data Services by searching for locations that intersect with the current map view.
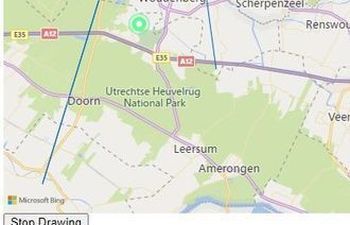
Draw Search Area
This sample shows how to combine the drawing tools with the spatial math module together filter pushpins that intersect with a drawn area.

Filter
This example shows how to use the execute and toString functions of the Filter and FilterGroup classes by performing a bunch of tests.
Find all counties that intersect a line
This sample shows how to find all the US counties that intersect a line.
Find By Property
One of the simplest ways to query a data source is to do a property based search.
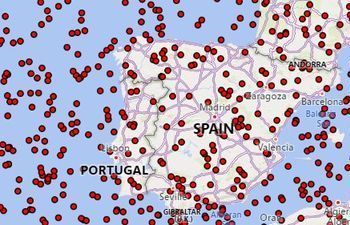
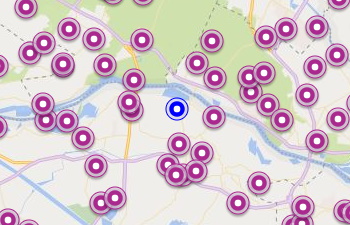
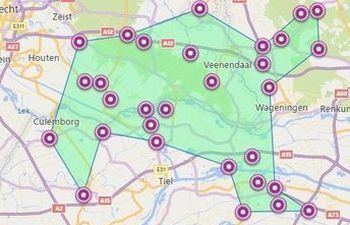
Find Nearby Search using the Query API
This sample shows how to do a nearby search using the Bing Spatial Data Services Query API to find gas stations that are within 25km of the center of the map.
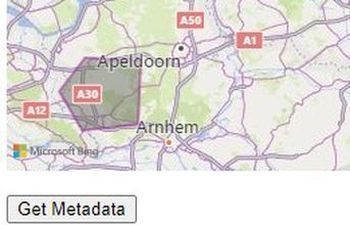
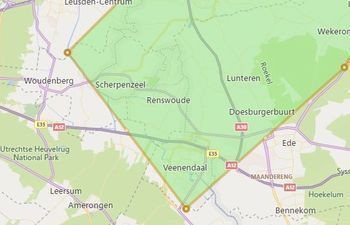
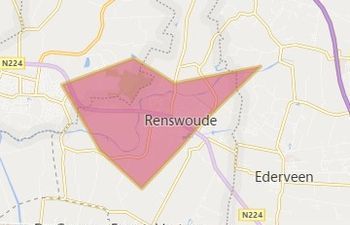
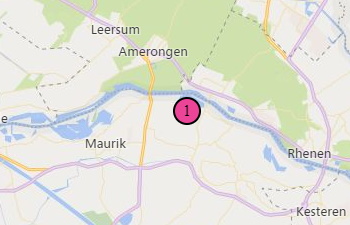
Load Single Boundary GeoData
This examples renders a PopulatedPlace (city, town) boundary for the Location that is in the center of the map view when the map is loaded.
GeoData Choropleth Map
This sample shows how to create a simple choropleth map which retrieves boundary data from the GeoData API in the Bing Spatial Data Services.
Load Multiple Boundaries GeoData
This code sample shows how to request the boundaries for 5 zip codes and render them on the map.

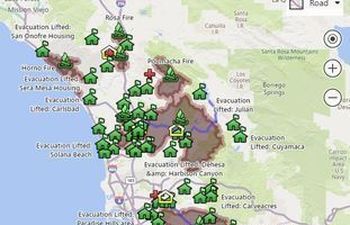
GeoData Search Boundary
If the search location has an entity type value that is supported by the GeoData API, a boundary will be requested and if available, displayed on the map.
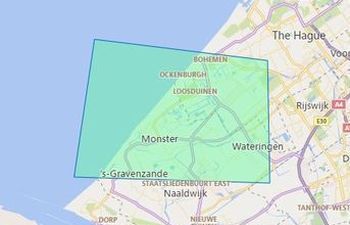
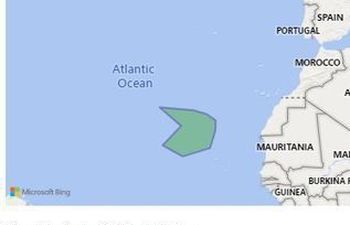
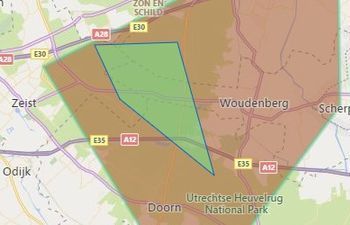
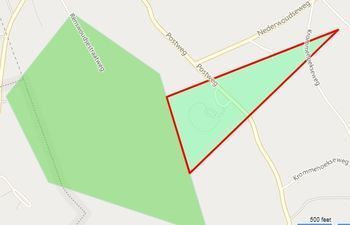
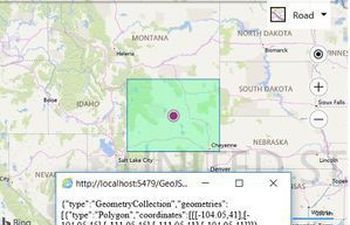
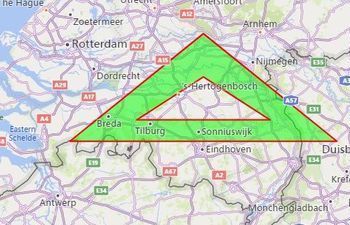
Intersection Query
This sample shows how to take a polygon and pass it into the Bing Spatial Data Services to perform an intersection query.
/screenshot.jpg)
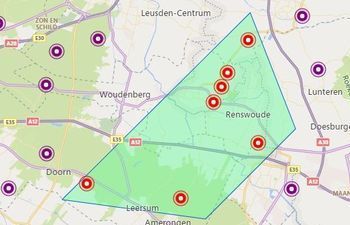
Load all results (parallel) using Query API
This sample shows how to load all results for a query by making parallel requests.
/screenshot.jpg)
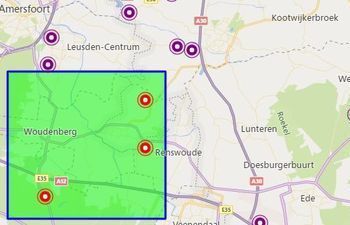
Load all results (recursive) using Query API
This sample shows how to load all results for a query recursively.
Multiple GeoData Entity Type Boundaries
This sample shows how to load multiple boundaries for different entity type.
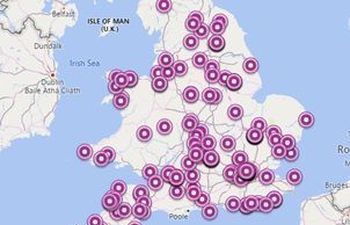
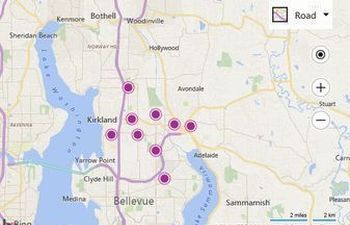
Paged Search Results
This code example takes a data source and performs an initial radial search of 10 kilometers. It then displays the first 10 results on the map and also creates a list of the results below the map.
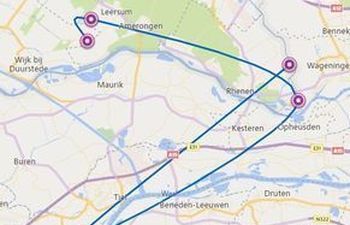
Along a Route Search
This example shows how to search for locations along a route.
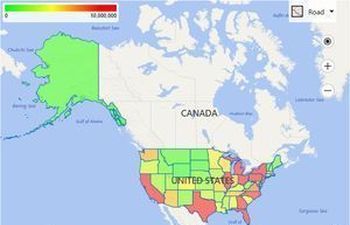
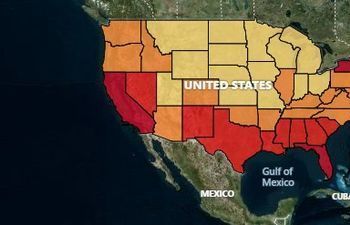
Search Result Choropleth Map
Running this code will display a map of the USA with color coded US states based on population.
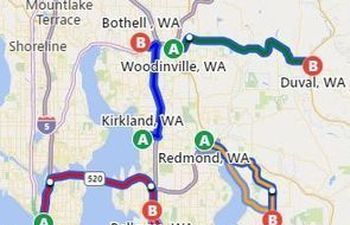
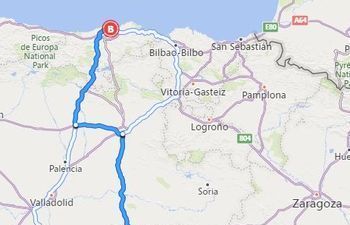
Sort Query Results By Driving Distance
Sort Query Results By Driving Distance.
Basic Core Spatial Math
Running this code will display a map with a geodesic line, with two pushpins on it. Below the map some calculated values are displayed.
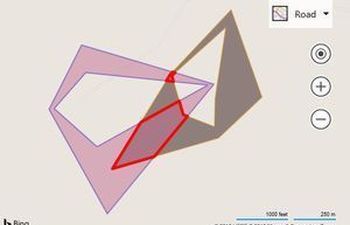
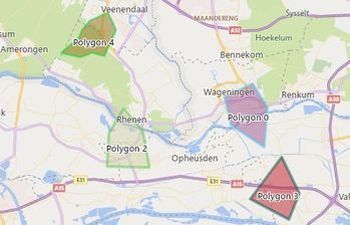
Geometry Binary Operations
This example loads a map with two random polygons where you can try different binary operations to be performed against the polygons.
Calculate Distance from Route
This sample shows how to use the Spatial Math and Directions module to calculate the distance a point is from a route line.
Cardinal Spline Features
This sample shows provides a set of controls to test the various features of the Cardinal Spline function.
Cardinal Splines Basics
Generate the locations of a cardinal spline that passes through these locations.
Concave and Convex Hulls
This sample shows how to calculate convex and concave hulls for a set of pushpins.
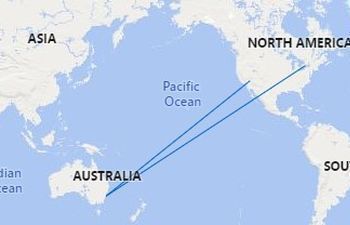
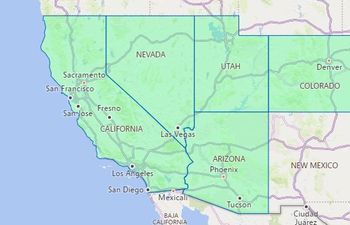
Geodesic Path with Arrow
This sample shows how to generate a geodesic path (path that follows the curvatur of the globe) between a start and end location.
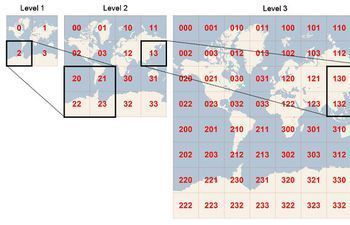
Quadkey Locator
To optimize the indexing and storage of tiles, the two-dimensional tile XY coordinates are combined into one-dimensional strings called quadtree keys, or “quadkeys” for short. Each quadkey uniquely identifies a single tile at a particular level of detail, and it can be used as an key in common database B-tree indexes.
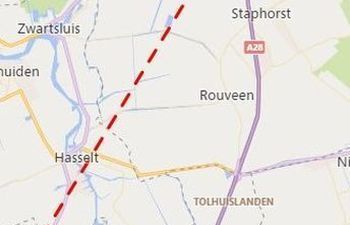
Select line segment of Polyline
This sample shows how to use the Spatil Math module to calculate which part of a polyline was selected.
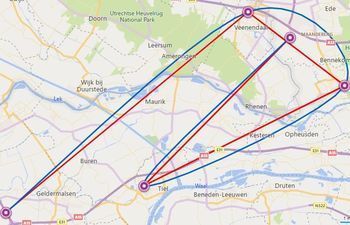
Select Pushpins Along a Route
This sample shows how to use the Spatial Math and Directions module to calculate which pushpins are within 1 mile of a route.
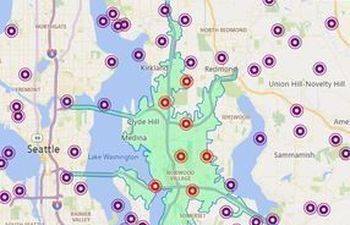
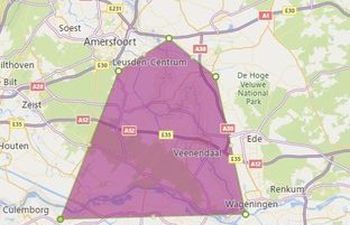
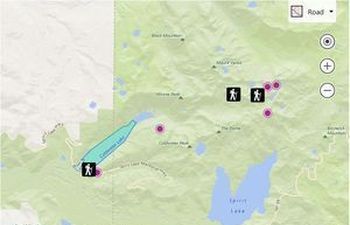
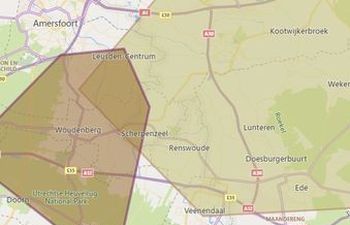
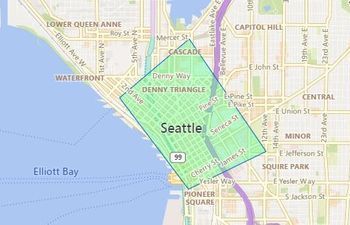
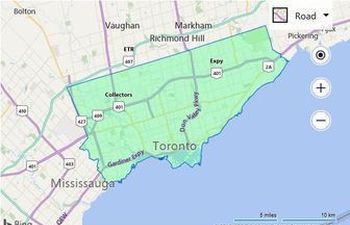
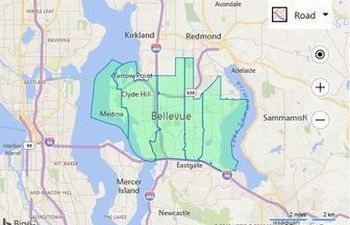
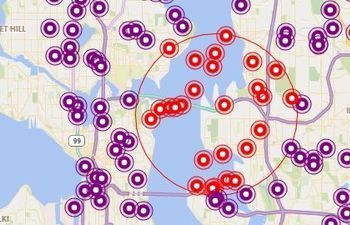
Select Pushpins within an Isochrone
This sample shows how to retrieve an isochrone (drive time polygon) from the Bing Maps REST services, and then filter the pushpins on the map that are within the isochrone.
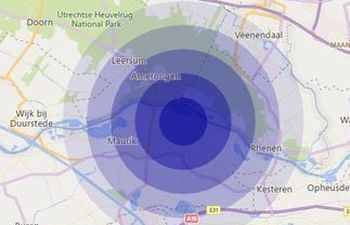
Select Pushpins within Radius
This sample shows how to use the Spatial Math module to filter locations that are within a specified distance (radius) of a location.
Calculate Tile Bounds
Running this code will load the map and display a polygon and pushpin above each map tile in the current map view.
Test Data Generator (4)
Often when creating a demo or trying to test a new application you need to create some test/mock data.
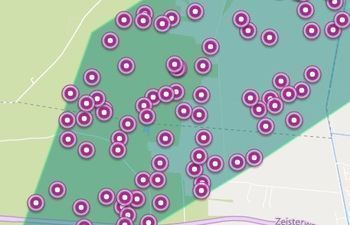
Generate Pushpins within a Polygon
This sample shows how to use the TestDataGenerator and the Spatial Math module to generate random pushpins.
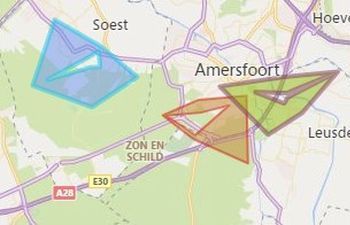
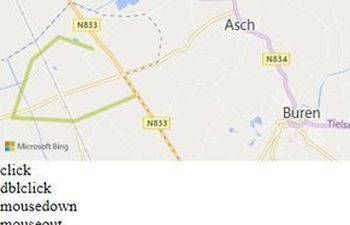
Generate Test Polygons
This sample shows how to use the TestDataGenerator to create random polygons using the getPolygons function.
Generate Test Polylines
This sample shows how to use the TestDataGenerator to create random polylines.
Generate Test Pushpins
This sample shows how to use the TestDataGenerator to create random pushpins.
Tile Layer (5)
Overlay raster tile layers on top the map using the same tiling system used by the base maps.
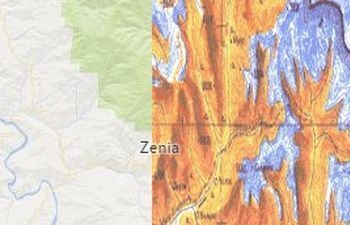
Image Overlay Tile Layer
This sample shows how to extend a tile layer such that it breaks an bounded image overlay up into invidiual tiles and renders it.
Custom Tile Layer
This sample shows how to create a map which only renders a custom tile layer and not the standard base map tiles.
Quadkey Tiling System
This sample shows how to create a simple tile layer which points to a set of tiles which use the quadkey tiling system.
Web Mapping Services (WMS)
This sample shows how to create a simple tile layer which points to a Web Mapping Services (WMS) which generates images for requested bounding boxes.
Tile Layer X Y Zoom
This sample shows how to create a simple tile layer which points to a set of tiles which use the x, y, zoom tiling system.
Traffic (2)
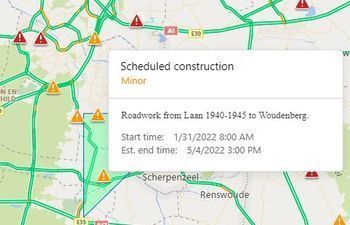
The Bing Maps web control provides two types of traffic data through the Traffic module. The first type is a tile layer that shows traffic flow data. The second type of traffic data is traffic incidents.
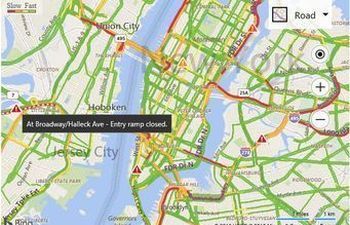
Traffic Module
This examples shows how to display traffic data on top of the map.
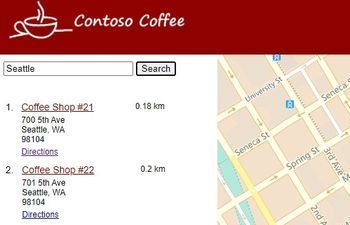
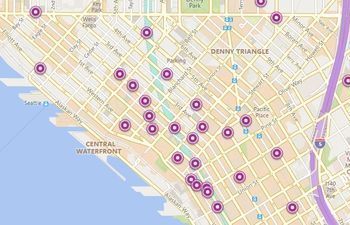
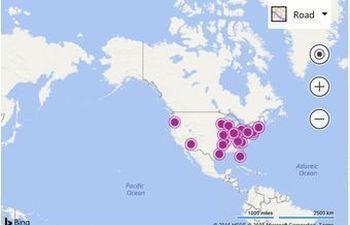
Simple Store Locator
This code sample demonstrates how to create a store locator in plain javascript.
User Location (3)
Obtaining a user's location can easily be done using the W3C Geolocation API. This API is exposed through the navigator.geolocation property in the browser.
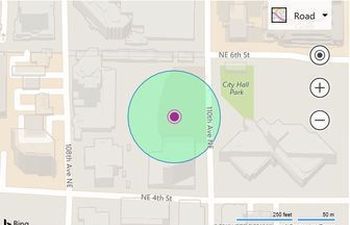
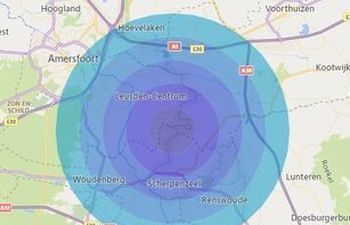
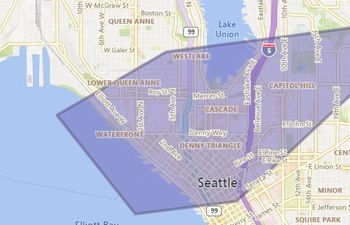
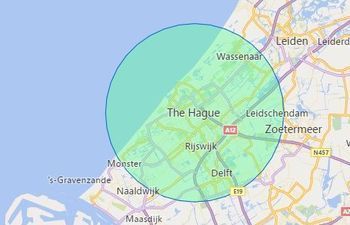
Geolocation Accuracy Circle
This example calculates a regular polygon with 36 sides centered on the user’s location and renders it as a polygon.

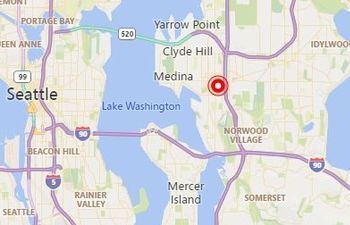
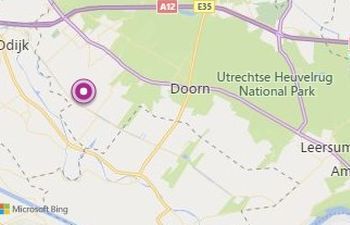
Displaying a User Location
This example shows how to request the user's location and then display it on the map using a pushpin.
Continuously Tracking a User Location
his example shows how to monitor the user’s location and update the position of a pushpin as the user moves.
Well Known Text (3)
Well Known Text (WKT) is an Open Geospatial Consortium (OGC) standard that is used to represent spatial data in a textual format.
Well Known Text Read
This example shows how to parse a Well Known Text string value into a Bing Maps shape and display it on the map.
Read Write Paste
This example shows how to read and write WKT. You can also paste your own WKT in the text area.
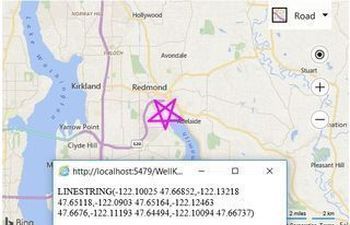
Well Known Text Write
This code example shows how to convert a Bing Maps shape into a Well Known Text string value and display it using an alert.